Escape Analysis in Golang
Basically every programming language has its own memory models. Every variable, constants are stored in some physical memory location. Those memory locations are accessed by pointers. Pointers such as stack pointer, instruction pointers, etc.

“Quality is never an accident; it is always the result of intelligent effort.” — John Ruskin.
Some key points are discussed as
- Memory: Memory is like a brain. It is used to stored data and instructions. It’s mainly divided into three types.
- Cache Memory
- Primary Memory/Main Memory
- Secondary Memory
2. Variables: Variables are a name given to a memory location. We(programmers/schedulers) can manipulate as per need and we can assign a new value to the same memory location.
3. Constants: Constants are also a name given to a memory location. We(programmers/schedulers) can not manipulate/assign a new value to the same memory location.
Now as we know about memory while running software generally usage two major memories as
- Stack: Stack is a block of memory allotted to each function. Memory is calculated on compile time.
- Heap: Heap is a block of memory allotted demanded by your software at runtime.
Before goes into deep some terms must know
- Escape Analysis: Gc compiler does global escape analysis across function and package boundaries. It checks a memory that it really needs to be allocated at a heap or it could be managed within a stack itself.
- Function Inlining: Only short and simple functions are inlined. Function inlining is nothing but the whole code replaces the function call.
- Command For Escape Analysis:
go build -gcflags="-m"Go runtime decides which variable goes to stack and which goes into a heap memory location.
1. Stack Analysis
Let’s take an example of it.
package mainimport "fmt"func main() {
    fmt.Println("Called stackAnalysis", stackAnalysis())
}//go:noinline
func stackAnalysis() int {
    data := 55
    return data
}
In the above main function, we took a simple function call for stackAnalysis and the function stackAnalysis returns int value.
So let’s look for output

So GC provides escape analysis for the program. Output as like
- line 6:14 tells us that Called stackAnalysis which is a string literal escapes to the heap. fmt.Println() statement in code.
- line 6:51 tells us that function stackAnalysis called and escapes heap as every function pushed into a function stack.
- line 6:13 tells us that the main function is escaped to the heap same as above stackAnalysis function.
The meaning of escapes to the heap is variables needs to be shared across the function stack frames [between main() and Println()]

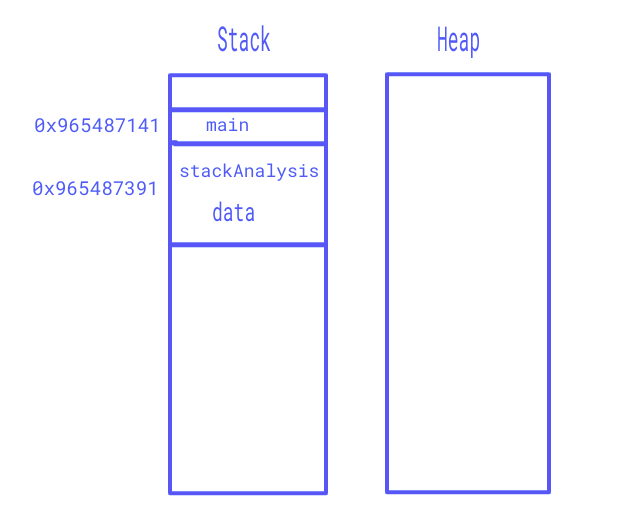
In the above figure, the main and stackAnalysis function allocated over a stack. As function has it’s own variables so that is also allocated to the stack somewhere. And when the function returns then all variables associated with that function also getting removed from memory. So compiler does free from its job done called Garbage collection.
2. Heap Analysis
Let’s take an example of it.
package mainimport "fmt"func main() {
   fmt.Println("Called heapAnalysis", heapAnalysis()
}//go:noinline
func heapAnalysis() *int {
   data := 55
   return &data
}
In the above main function, we took a simple function call for heapAnalysis and the function heapAnalysis returns *int value.
So let’s look for output

So now GC provides some different kinds of output here. As function heapAnalysis returns *int variable which is used in the main function as it’s accessing outside heapAnalysis function.
So globally access variables must be moved to heap as it requires runtime. So the output line 11:2 shows the same as the data variable moved to the heap memory.

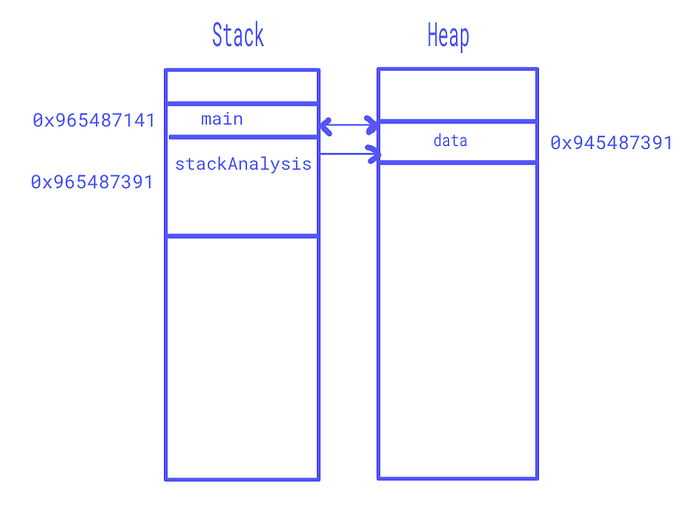
In the above figure, the main and stackAnalysis function allocated over a stack. As function has it’s own variables so that is also allocated to the stack somewhere. But compiler do checks that value returned its pointer and that value used to another function so variable moved to a heap and now main function access that variable from the heap.
You can see code for escape analysis on GitHub.
So simply, Escape analysis is a way to see how we could optimize our application performance. When your code is optimized then its also reduced pressure from garbage collector(GC).
References:
